


In this article we unveil why we believe that the biggest financial tsunami we will ever see in our lifetime is just around the corner.
Digging deep in the past helps our online trading academy to find the future
Economics is straightforward and simple so, allow us to explain some basic economic principles, to help you understand where we are present, what got us to this point and where we are headed in the nearest future. Our online trading academy has an analytical diagnosis we perform yearly, and occasionally we run some metrics that catch our attention and gets our sixth sense agitated.
In the year 2007, our metrics would have been alarming noticing the prices of homes in relation to the income of the average American and the fact that a lot of people most likely can’t afford their homes. The difference in their level of income, and the market prices of their houses were tremendously far apart and unless they were able to make more money prices were going to have to fall eventually. When you consider the relationship between how much people were making and the costs of homes, it clearly pointed to the fact that people couldn’t afford the houses they lived in. Their income hasn’t been raised to justify their expensive home prices.
Although it’s difficult to say how big the problem was going to be in 2007, it was easy to see that we had a problem in real estate. And when the housing bubble finally started to burst, and organizations and institutions began selling and shorting stock market indices, we could have shorted the markets right along with them.
When we in our online trading academy performed our analysis last year, we suddenly saw something that did not add up. We go ahead to this year, 2019, and we see something else that doesn’t add up. Suddenly we have a combination of metrics and facts that indicate we are going to have a financial tsunami that is probably the biggest we will ever see in our lifetime. This will be a fantastic opportunity to create wealth for each of you if you are on the right side of the trade.
How many of you would like to read about the things that we in our online trading academy have noticed? Our online trading academy will share the information with you, and you can process it and decide what you think the result is going to be.
So let’s start from the basics because we have to help you categorically understand foundational things like GDP, which means we also have to talk about government debt, what they do and exactly how they do it, which will lead us to talk about bonds and how that works. Moreover, we also need to mention what the Federal Reserve (FED) does and the relationship between all of these. Before we go through those, we would like to talk to you about market cycles.
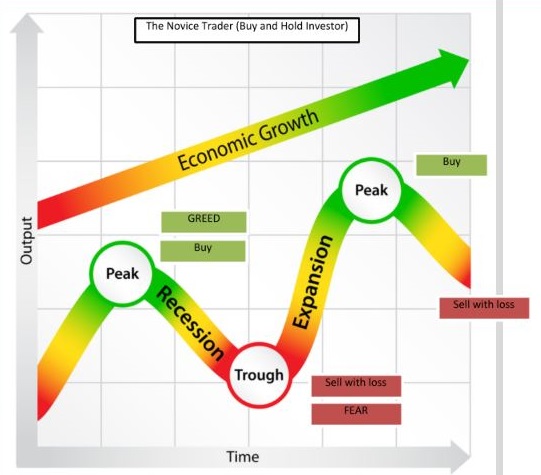
Market cycles and how we should engage in the market vs. how people engage most of the time
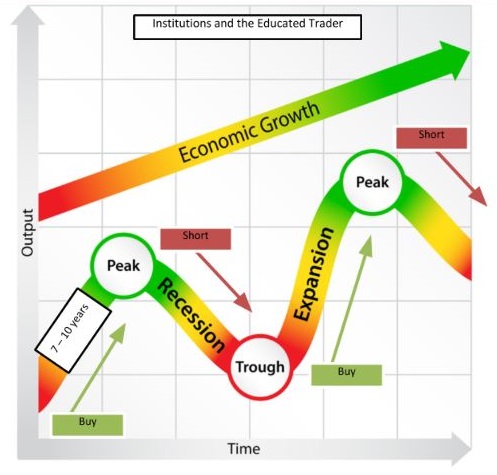
So, we have these cycles that go on and last for about seven to ten years, and in the last twenty-five years, we have only had two bear markets (Recessions). Bear markets are rare occurrences but are extremely valuable. You never want to miss a bear market because that’s where the catch-up opportunities are real. Shorting the markets with the big institutions and once markets recover, we can start buying and accumulate positions to create efficient and effective long-term wealth. Therefore, we want to ensure we know when the next one is going to be and how immense it will be.
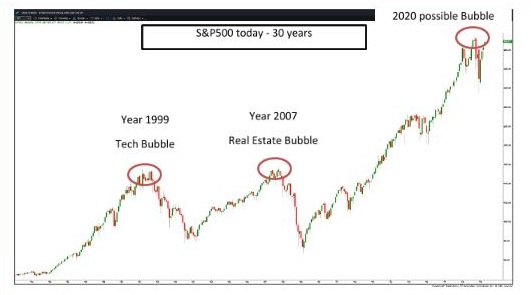
There is usually a catalyst that causes markets to crash, ranging from the “tech bubble” to the “real estate bubble.” The operative word here is “bubble,” and you should note that bubbles are rare and unique as they do not occur frequently. But recently, we’ve had bubble after bubble. And we are in another bubble possibly now, which is just really absurd to have so many bubbles in a row. Thus, the question is, what exactly is going on? Why do we have these weird occurrences and how did we get here?
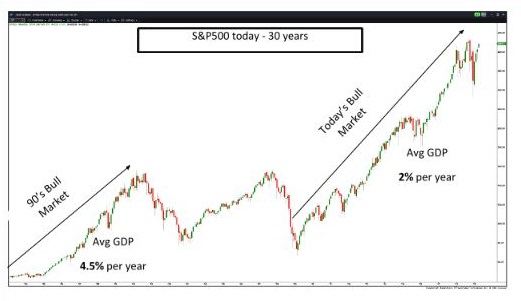
One of the metrics that really got our attention was the bull market in the ’90s, which was actually one of the biggest bull markets in the stock market history. However, our economy was growing at record highs during this period. There was a 4.5% average GDP growth per year during this period, which indicated asset expansion. We are currently experiencing the most extended bull market in history, but the backdrop is different. We are having one of the most anemic GDP growth rates in history, which is only about 2% and that doesn’t correlate at all. How is it possible to have asset prices going that high during a period when the growth rate is so low? We decided to pay closer attention to it, and we discovered something that blew our mind.
Recessions and the real reason for the great depression
We just learned that we have recessions every 7-10 years. Some recessions can be as bad as a depression. Depressions are extreme and severe; we’ve had only one depression in the last hundred years.
Let us give you a little history lesson about this. Are you aware of what the primary causative agent for the major depression was? It was a credit bubble that caused the stock market bubble of 1929, but it wasn’t just that alone, because if you have a bubble and it crashes it may not necessarily result into a great depression, so let us explain what actually happened.
We know that our economy lives from access to capital and ability to borrow. If you can’t borrow, it really squashes the economy. Our banks help to promote this. When you deposit money in the bank, the bank doesn’t just hold on to the cash waiting for you to come for it, they actually lend it out, but the reserve rate is only 10% which means they can lend out 90% of your money to someone else.
So, let’s say you deposit ten thousand dollars in the bank, they lend out nine thousand dollars out of it right away and keep the one thousand dollars as a reserve in the volt. So here is the fantastic dynamics: When Mr. A deposits ten thousand dollars, the bank can lend out nine thousand dollars to Mr. B. Once it hits Mr. B’s account, they can lend out 90% of that to Mr. C, which means just one ten thousand dollars deposit can create a hundred thousand dollars of new money in the system. This only happens if people are willing to borrow. People are encouraged to borrow by lowering the interest rate, and if you don’t want people to borrow as much, you simply just increase the interest rates. This is how the FED controls the economy. When they want to speed up the economy, they merely just lower the interest rate, and this causes expansion of money supply because more people borrow. The more people spend, the more economic activities we have and when the FED wants to slow down the economy for a bit, they increase interest rates. This is how the FED manipulate and control the economy.
Now pay attention to this: When the 1929 stock market crashed, what led to the great depression was that banks were not just lending out money, they were also investing in the financial market which during this period, was legal for them to do. So, when the banks lost your cash during this period, and you hear about it, you merely hurry to the bank to get your money back, but they obviously don’t have it anymore. It was during this period that about 25% of our banks crashed. People back then lost faith in the banks, so they run to their banks, withdraw the money that was still available and merely take it to their houses, bury it in the garden and put it away in coffee tins or under the mattress. The result of this was that there was no money in the economy, which meant no economic activity, which crippled the economy during this period. Money that cannot be used in the system is simply dead money. It took quite a bit of time for people to start trusting the banks again.
This right here was the primary cause of the great depression because there was no money in the economy, it just dried up and died, and it took a while for the economy to recover from it. As a result of this, the US government broke up the banks and passed a new act which specifically only allows the banks to lend out the money, and they were no longer allowed to invest it, and this act was called the Glass-Steagall Act of 1933. This was when all the different financial institutions were broken up, so if you were a bank, you could not be an investment bank and an investment bank, cannot be a broker, and a broker cannot be an insurance company. To further encourage people to trust the banks with their money, the FDIC insurance act was passed, which meant, if the bank loses your money, we’ll put it back there for you, which means you are at no real risk at all.
Are recessions necessary and healthy for an economy?
So, people finally started trusting the banks with their money again, and the economy started regaining life. Things were going smoothly for a while, and then in 1970, another financial crisis started. The Federal Reserve reacted and increase the interest rate during this period. Everybody wanted them to reduce it, but the FED didn’t. Ultimately the FED wanted to clean out the economy but why?
Recessions are quite healthy for the economy because it cleans out weak holders of capital and makes the resources available for new and emerging businesses. Although recessions are healthy, we don’t like them, and we don’t want them, so we try to keep them as short as possible.
During this era, the Federal Reserve was being managed by bankers and bankers are usually real-world thinkers. The bankers understood the healthy nature of recessions, and they continued to run the Federal Reserve until 1980.
Everyone started complaining, and among the group of people complaining were economists, so the economists came in and started to run the Federal Reserve. Economists are much different from bankers because they work on theories, not real-world experience, and the problem with theories is that the result is usually unknown. The economist then said we could have good economic cycles and mild economic recessions. Whereas, historically, when you have a great economic cycle, it is generally followed by a massive recession, meaning it was usually proportionate. For example, when you party hard, you are bound to have a big hangover. The glorious plan by economists to reverse this was to drastically lower the interest rates, so anytime they observe a bit of weakness in the economy, they reduced the interest rate, and this kept happening. By now you understand what happens when you continue to lower interest rates. You encourage borrowing and the spending capacity of people increases, which in turn leads to higher asset pricing.
This is precisely what caused the stock market bubble in 1999 to burst. The only reason it didn’t cause another great recession was that the banks weren’t invested in the stock market anymore.
Tech bubble of 1999 – banks can now invest again and how it led to the real estate bubble
In 1999, the Glass-Steagall act was repealed, and once again banks could invest. This time only in assets. The banks decided to invest in real estate, and by the time another bubble was created, the interest rate was already at 0%. So when the interest rates were at zero, and the bubble starts to burst, markets start crashing, there was nowhere else to go for the FED. Interest rates could not be lowered as it was already at 0%. As a result, they started off with a new theory which was to print money and buy bonds, driving bonds up, which will, in turn, lower the interest rates. Moreover, when interest rates are really low, banks can no longer make money from banking, but they can still make money from investing. So, banks decided to start investing in the financial market again, specifically in bonds.
What does this mean today? What are the questions you have to ask yourself when investing today?
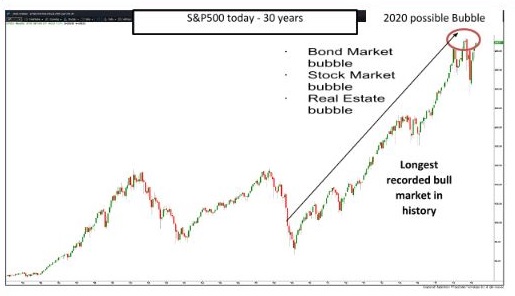
As we know it, the bigger the bubble “the more partying,” the more devastating the aftermath “the bigger the hangover” when it finally crashes. Currently, we do not just have a bond bubble, we are also in a stock market bubble simultaneously. We are currently running the longest time ever in the past 100 years without a recession, so the pressing question you must ask yourself is as follows:
Is another crash further away or closer?
You should probably look at the average recession timeframe in history to help understand what might likely happen or not.
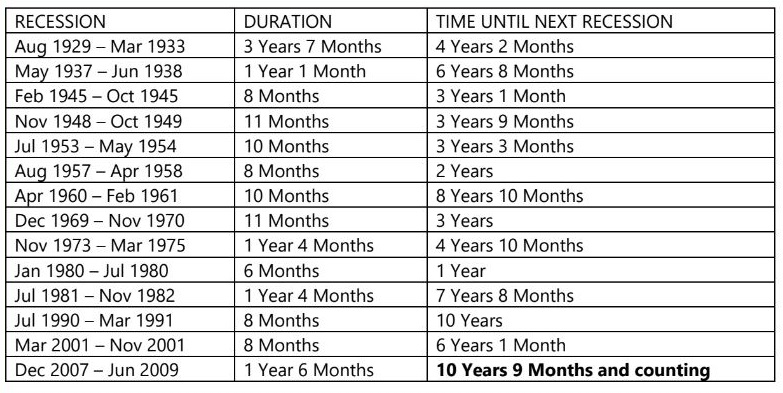
We are currently in the longest ever recorded time without a recession. Now it has been 10 years and 9 Months.
What is the current market worth in relation to its precursor bubbles and what would be the potential for loss?
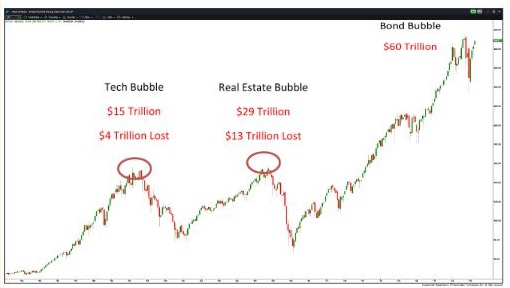
When the tech bubble of 15 trillion dollars crashed, the market lost about 4 trillion dollars. When the real estate bubble of 29 trillion dollars crashed the market lost around 14 trillion dollars. Today the global bonds market is currently worth about 60 trillion dollars. Let us assume it loses 30% of its value that’s about 20 trillion US Dollar. We are looking at one of the biggest bubbles in history, so the effect is bound to be massive.
On March 1st, 2018, Greenspan, who helped engineer the bond market said: “We are in a bond market bubble.”
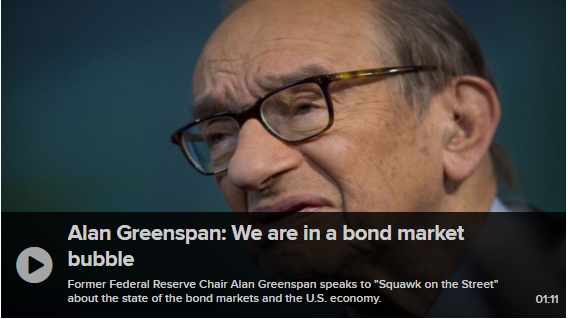
In another interview before that, Greenspan issued a warning “that bond market is on the cusp of collapse that also will threaten stock prices.”
Are we also in a real estate bubble?
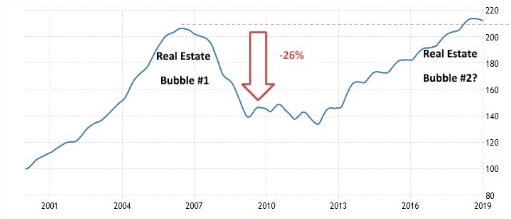
Let us look at the Case-Shiller home price index. This specific index measures changes in the prices of single-family houses. It compares the sale prices of the same properties over time. The extreme increase in price between 2008 and today is reflected in the index (see below chart) which indicates we do not just have a bond bubble, but we also have a real estate bubble brewing.
The current index is at record highs – even higher than where it was when the Real Estate Bubble of 2007 crashed. Ask yourself if you want to buy a new home at all-time high prices.
Are we also in a stock market bubble?
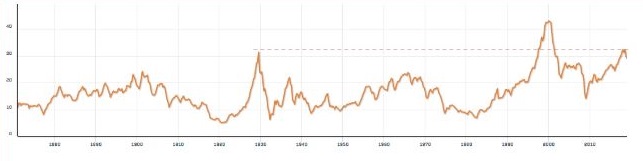
Shiller P/E ratio has our online trading academy really interested, and this is because it allows us to know if we are in a stock market bubble or not. The highest ratings ever recorded was in 1999, and this was in a bubble as well. Another bubble occurred in 1929 and today’s ratings have eclipsed the 1929 ratings, making it the second highest in about 140 years.
What would Warren Buffet say?
We don’t have to personally ask Warren Buffet on his opinion. No, we can just use his “Buffett Indicator” to understand whether the current market is overvalued or undervalued. The indicator looks at the Total Market Cap in relation to GDP. To sum it up when
- The ratio is below 75% markets are undervalued. Therefore you should look to buy
- The ratio is between 75% and 90% they are fair valued, so you should remain neutral
- The ratio is above 90% market is overvalued
- Anything above and below would be significantly over or undervalued
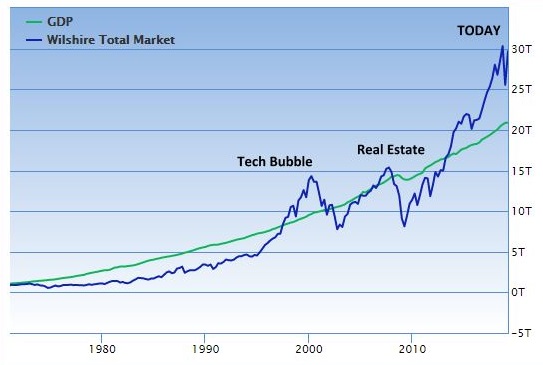
So where are we today? The ratio between the green line, which represents GDP and Blue line which represents the Total Market Cap of S&P500 is at over 140%. Remember, anything above 90% is overvalued.
As per Warren Buffett, this is “probably the best single measure of where valuations stand at any given moment.”
Our online trading academy sums it up!
This means we are not just looking at one bubble; we are experiencing three bubbles simultaneously:
- Bonds
- Real Estate
- Stock Markets
The question is not if the markets will crash, it is only a question of when. Our online trading academy let you decide if we are closer or further away from a possible recession and how much of a correction we can expect.
If you want to learn more about professional trading and investing across multiple asset classes such as forex, futures, and stocks, please sign up HERE for free at our online trading academy www.onlinetradingcampus.com and get access to a free three-hour introductory course.
Happy trading!
Author Bio: Bernd Skorupinski teaches the undiluted truth about trading and investing at Online Trading Campus and takes you through what it takes to be a consistently successful trader. His favorite moment as a trading mentor is the way peoples’ eyes light up with excitement and confidence when they understand how Supply and Demand trading strategy works and how it can help win in the trading arena. He believes in building core values and discipline that ensures his students do not succumb to the pressures and temptations of the market. He very much believes in following plans and strategy through. If you want to know more about the author Bernd Skorupinski please read HERE